


Table of Contents
- Introduction
- Data Wrangling and Data Cleaning
- Dashboard Based Story/Exploratory Data Analysis
- Conclusion
- References
Introduction
Global Superstore is a global online retailer based in New York, boasting a broad product catalogue and aiming to be a one-stop-shop for its customers. Global Superstore’s clientele, hailing from 147 different countries, can browse through an endless offering with more than 10,000 products. This large selection comprises three main categories: office supplies (e.g., staples), furniture (e.g., chairs), and technology (e.g., smartphones). Global Superstore’s largest demand comes from the U.S., Australia, China, France, and Germany. As for their sales revenue, it surpassed $4 million in 2014, a 26% increase from 2013. The growth in Global Superstore’s order volume experienced a similarly healthy growth; with more than 17,000 orders processed in 2014.
Data Source
Global Super Store is a customer-centric data set that has around 50000 values. It has the data of all the orders that have been placed through different vendors and markets, starting from the year 2011 till 2015. It also has Salesman & Returns data. The data was gotten from Tableau.
Data Wrangling and Data Cleaning
When we received our project for week 1, which required us to choose a product and work on a product sales insights analysis on any dataset of our choice, we asked each team member to submit a dataset they believed would be the best fit for the project. The team lead and his assistant selected the dataset offered by one of the members of the team Adefunke Ayorinde, after reviewing each contribution.
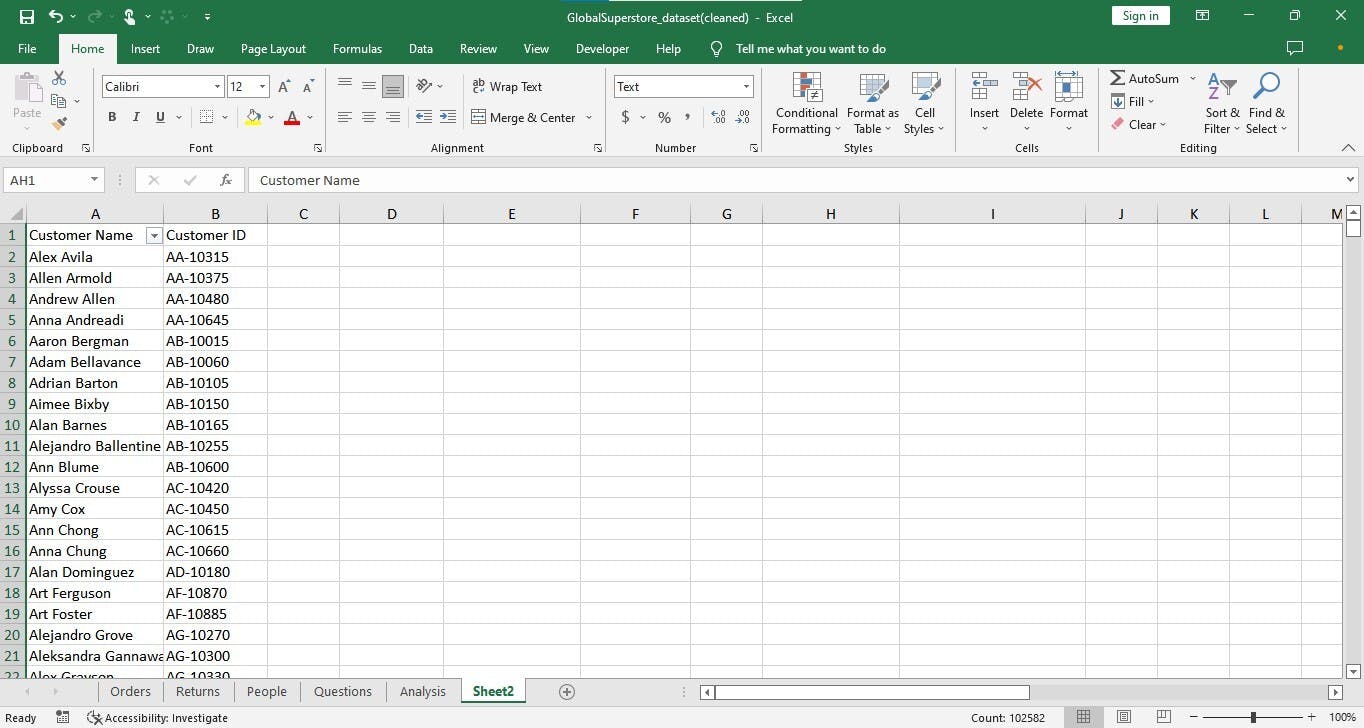
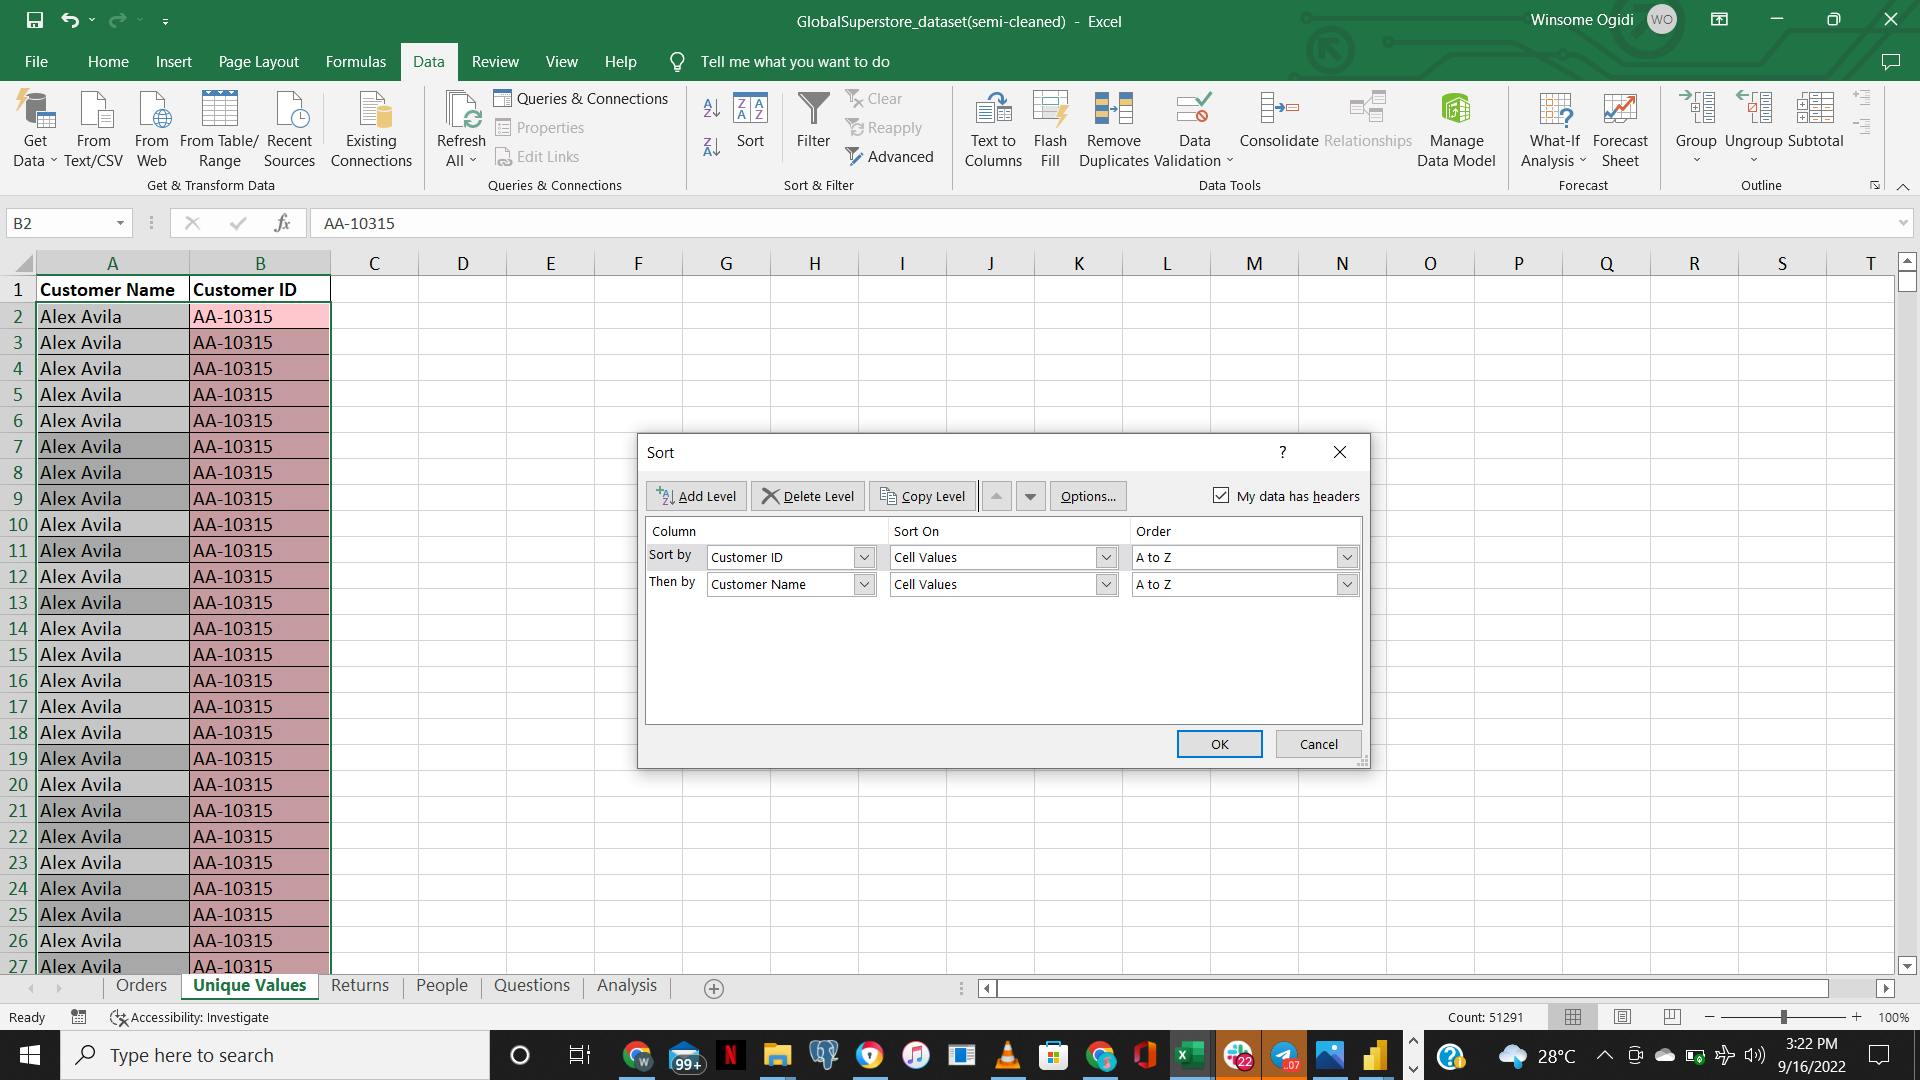
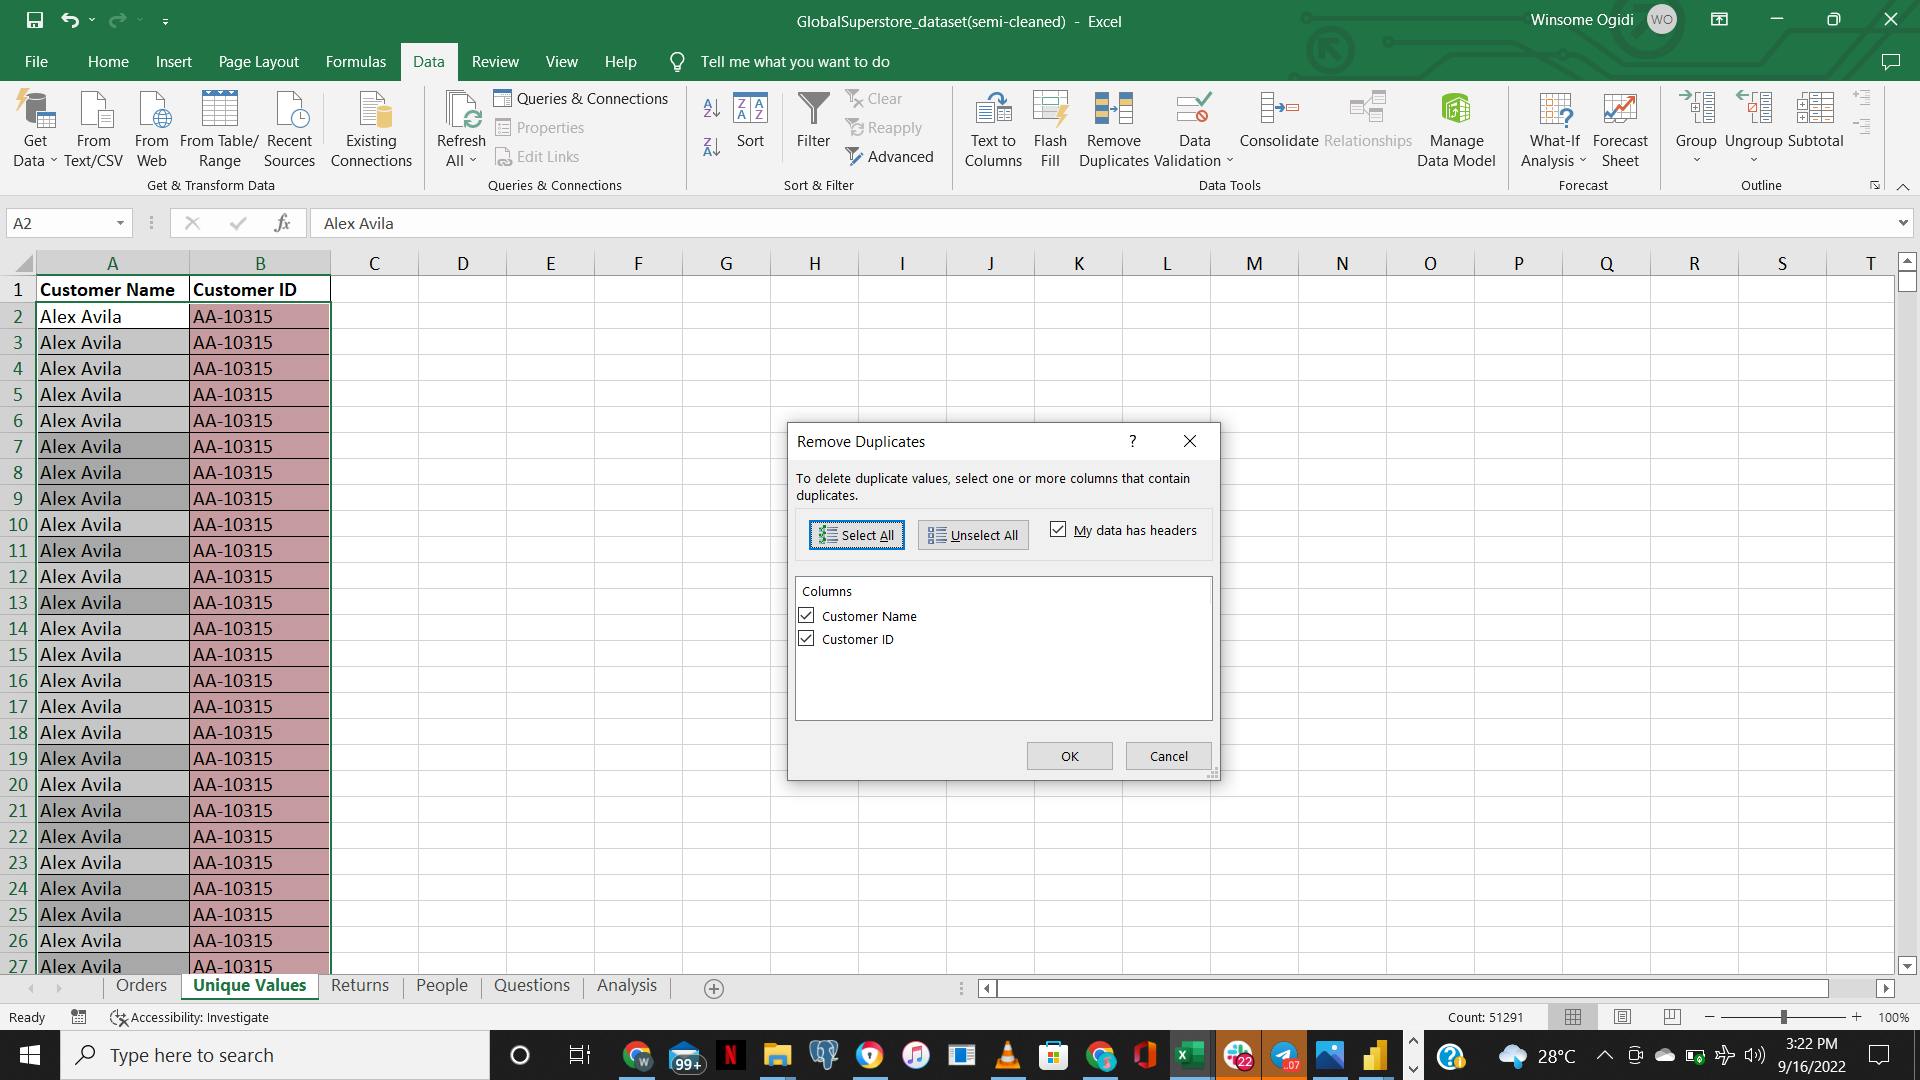
The dataset needed some initial cleaning, which Excel took care of by a subteam of 4. The cleaning process included filling in some blank cells, changing the data type of a few columns, splitting the columns for the order date and shipping date to extract the precise year, month, and date, and figuring out how long it takes for an order to be processed and shipped, sorting as well as few rearrangements. Some customers' IDs in the customer id field contained 2,3 or 4 instead of 5 digits, which was a problem. Sorting, Conditional formatting, Removing duplicates and VLOOKUP were used to overcome that.
After the cleaning in Excel, the following questions were asked in order to derive insights on sales and products:
- Which cities has the highest sales and lowest sales
- Which products has the highest sales and lowest sales
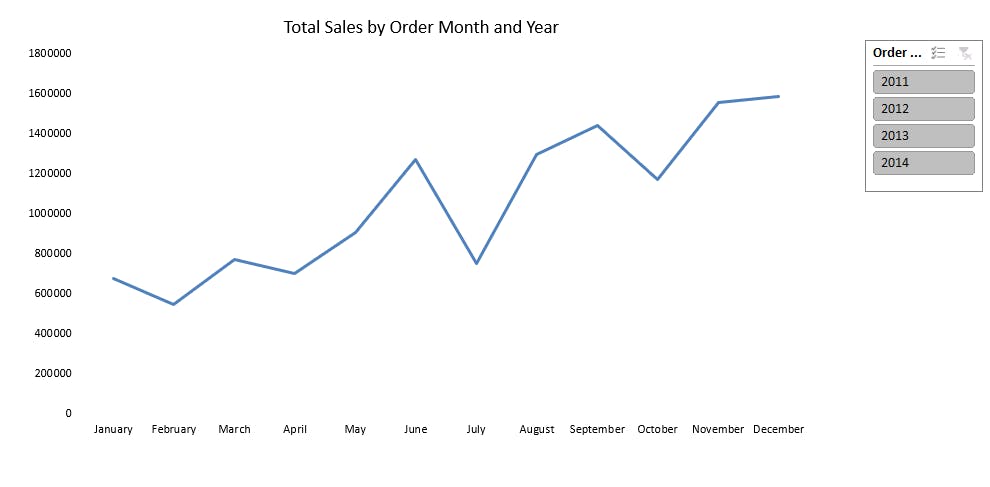
- What is the total sales based on order month and year
- Which product has the highest quantity sold and in what year
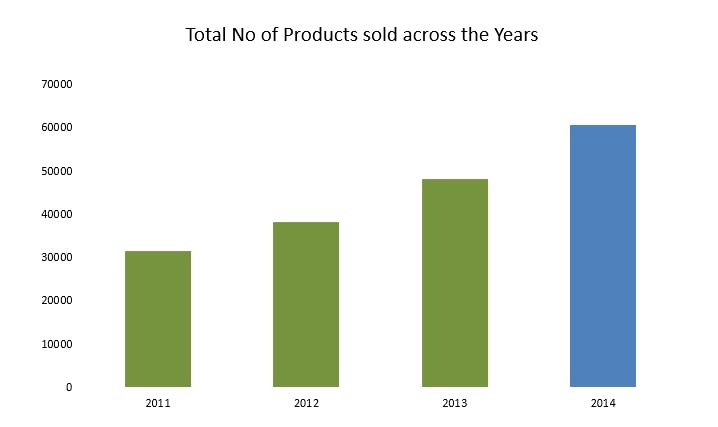
- What is the number of products sold across the years
- What is the total profit gained from each product
- What is the total shipping cost incurred for each product
- Which country has the highest sales?
What is the average sales incurred by products
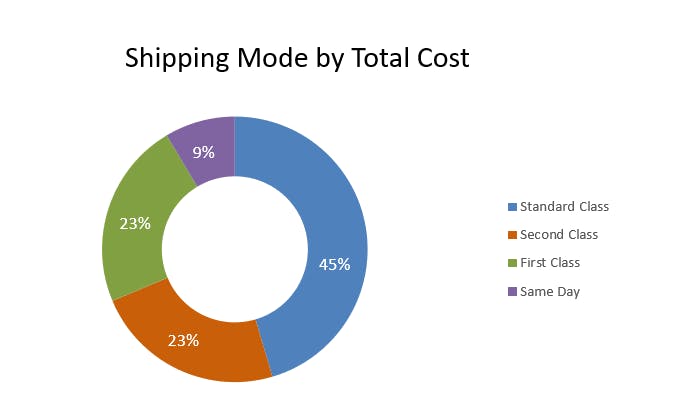
Which shipping mode gave the highest cost
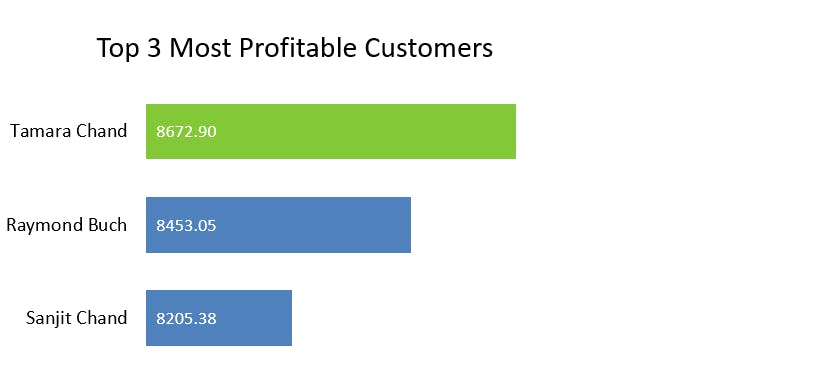
- Who are our top 3 most profitable customers
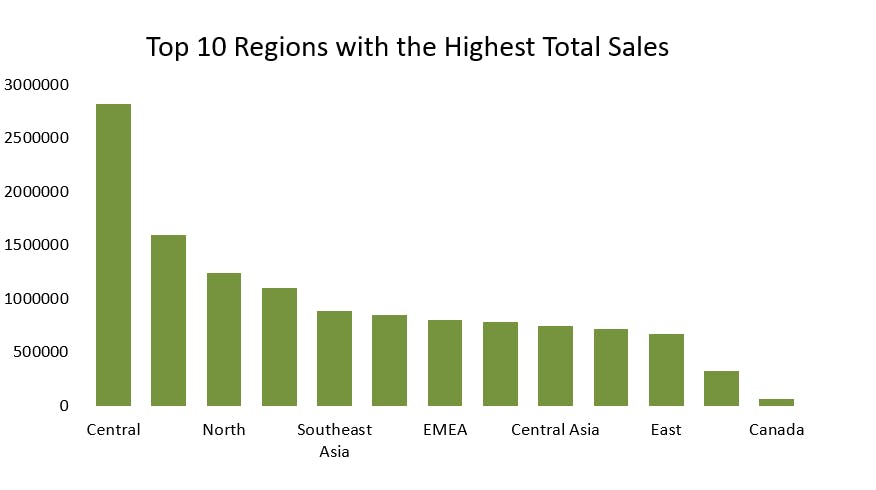
- Which region constituted the highest sales
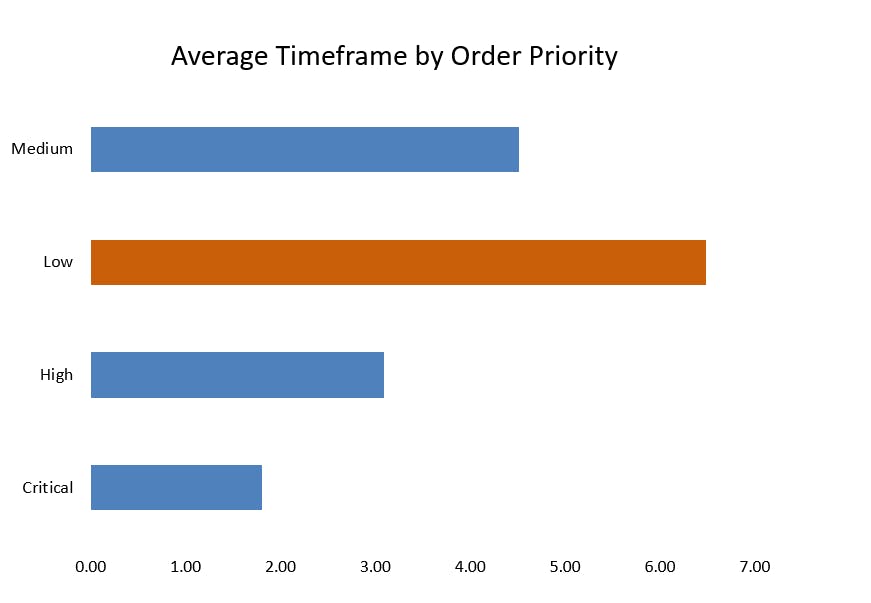
- What is the average time frame (ship date - order date) for each order_priority category
- What product category constitutes the highest returns
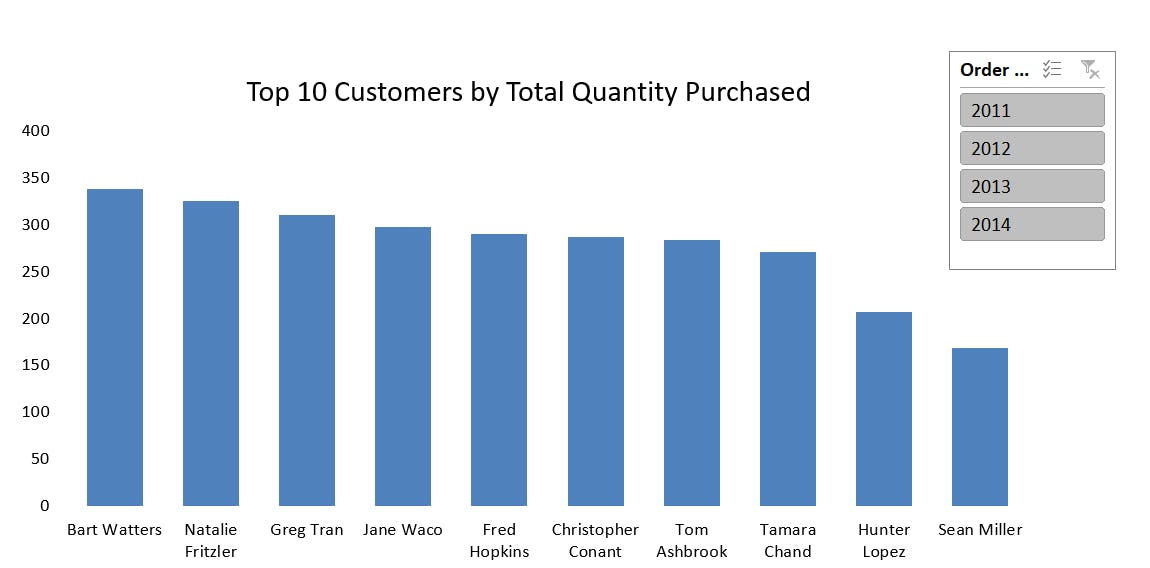
- Using the Most Purchases as a yard stick who would be the customer of the year in the respective years.
- From Which Market was the most profit made.
- We can also look at products with higher purchases. Why! Was it the product type(category), quality, affordable prices, location.
We were able to do some visuals on Excel using Pivot tables and Charts to show some of the insights discovered:
Dashboard Based Story/Exploratory Data Analysis
We advanced into the second to final step of our analysis on the fourth day of the sidehustle bootcamp. On the dataset that we had previously cleaned with Power BI, we were to conduct some analysis. A four-person subteam was assigned to do this.
Due to a few restrictions, we started later than expected. By 4 o'clock, we began a Zoom meeting where we looked at the cleaned data sets and went over the questions that were provided to offer context for the research we would conduct and more insights discovery. It was initially difficult because we were unfamiliar with the procedure, but as the saying goes, "Two excellent heads are better than one." Our four excellent heads were a blessing. We completed the entire process of integrating our tables, performed a few calculations to meet our needs and the task, and then moved on to the making of the dashboard, which was the most important step as it is an evidence of how data analysis processes and creates a room to tell the audience about our dataset and what was expected from us in a single screen.
We had to take a break at around 7 o'clock to respond to our own requirements, and we returned at about 9 o'clock. We kept working on the dashboards, which took us a while but thankfully we improved over time.
By 3 a.m. the next morning, we had completed everything and produced an outstanding and clean dashboard. Although the procedures and steps were not easy, it was a lot of fun and we learnt a lot.
Below were some of the things derived/dealt with.
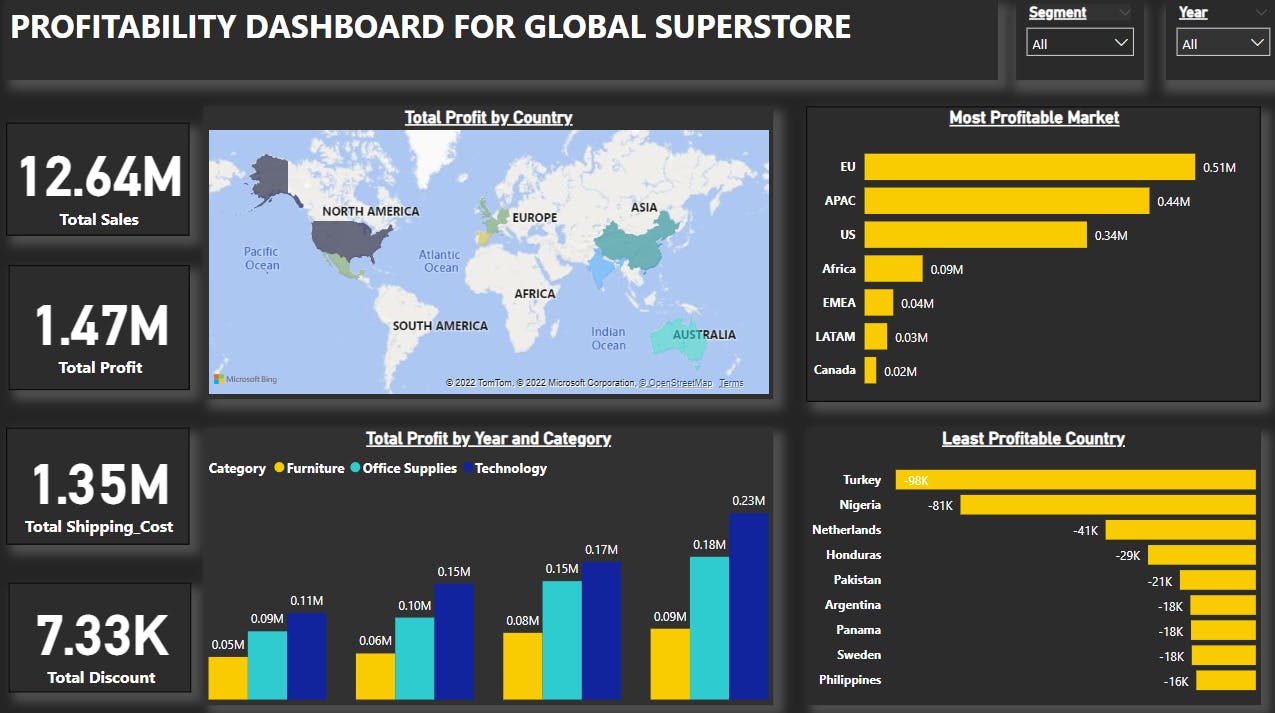
Profitability Dashboard.
- What was the total sales in the last four(4) years?
- What was the total profit in the last four years?
- What was the total cost of shipping in the last four(4) years?
- What was the total amount of discounts given in the last four(4) years?
- What are the top 10 most profitable countries in the last four years?
- From which market was the most profit made in the last four(4) years?
- What categories made the best sales in the respective years?
- Which 10 countries are the least profitable in the last four(4) years.
Sales Dashboard
- What is the total sales of products made in the last four(4) years?
- What is the total quantity of products sold in the last four(4) years?
- What are the top 3 countries by sales in the last four(4) years?
- What are the top product categories by sales in the last four(4) years?
- What is the yearly sales trend by month in the respective years?
- What countries returned the highest products in the last four(4) years?
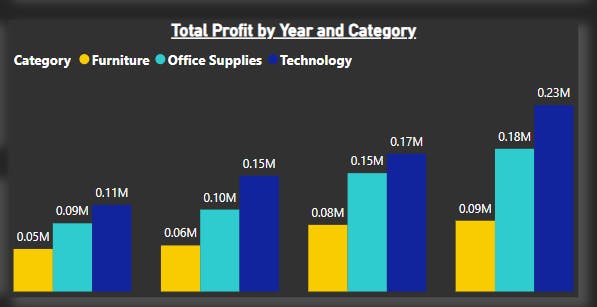
Analysis 1(Total Profit by Year and Category)
According to this analysis (which makes use of a clustered column chart), among the three categories, technology had the highest overall profit and the highest annual profit in 2014.
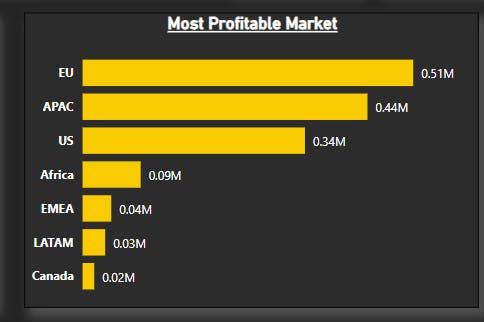
Analysis 2(Most Profitable Market)
According to this analysis(which makes use of a stacked bar chart) shows that the EU market is the most profitable market.
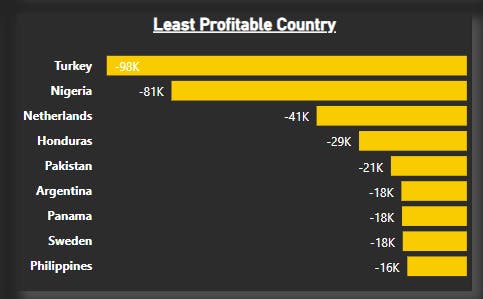
Analysis 3(Least Profitable Country)
According to this analysis (which makes use of a stacked bar chart), the Philippines is the least profitable country.
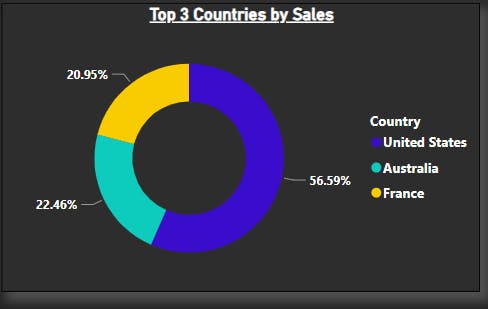
Analysis 4(Top 3 Countries by Total Sales)
This analysis(which makes use of a donut chart) shows the top 3 countries by sales. The United States was at the top(sales of 2.32 million), followed by Australia(0.92 million), followed by France(0.86 million).
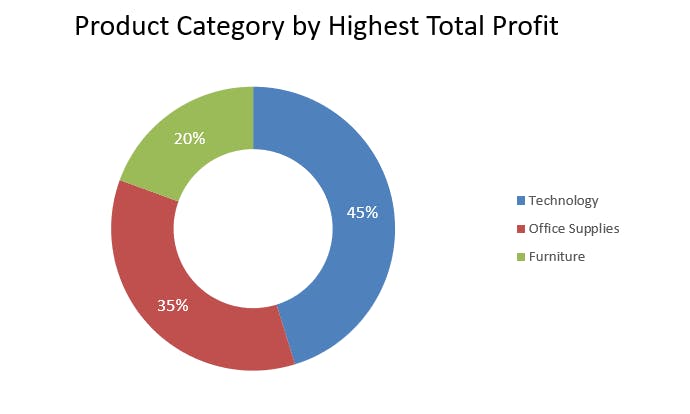
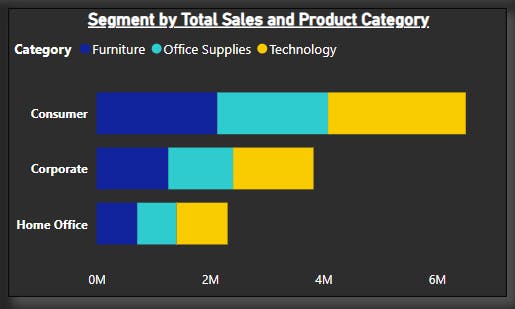
Analysis 5(Segment by Total Sales and Product Category)
This analysis(which makes use of a stacked Bar Chart) shows Product Category by sales.
DASHBOARD PRESENTATION
Profitability Dashboard for Global Superstore
Sales Dashboard for Global Superstore

Conclusion
We’ve analysed and visualized various use cases in the superstore dataset. We got some data driven and insightful results about the Profit and Sales as well as the Products that can be used to improve efficiency, productivity and future policies. We got to discover data inspired insights that can help make better business decisions and make work easier. We also found a trend over the year so preparations in stores and warehouses for the next year can be made accordingly. We can now confidently pick up more datasets to define use cases for, and visualize them in Microsoft Power BI.
#dataanalytics #globalsuperstores #bootcamp #hashnode @Ngsidehustle